I recently switched companies. Between jobs, I scheduled a couple weeks off to recharge before diving in with my new team, as I usually do. Recharging aside, I still needed a project. I can't sit idle for two weeks. I needed something to work on.
So I decided to finally build something I’ve wanted for a while, but haven’t been able to find: a desktop tracing app.
I’m a big believer in the value of tracing, especially in a distributed system. Every service I work on inevitably ends up instrumented with OpenTelemetry. Without it, many troubleshooting tasks tend to feel like a guessing game. Like wandering aimlessly in the dark.
Problem is, all of the trace explorers I’m familiar with are web-based.
I’ve never found a local-first, native application to explore local traces. Jaeger takes care of the “local-first” bit, and is honestly wonderful, but I still have to launch a webserver and use my browser. Maybe I'm picky, but I hate that.
So I built egui-trace. Feel free to submit suggestions for a real name.
Let's see it
As you can probably guess, the core of the app is a trace explorer.
Tracing data can be imported from a local file (drag-and-drop supported). Most services aren’t configured to save tracing data to a file though. They are built to send to an OTel endpoint.
To accommodate this, there is an OTel collector built-in. View > Collector will open a panel to configure the listen port and start/stop the collector. If your service is already setup to send to an OTel collector, just point it at that port and fire away.
Once traces have made it into the app, things should be fairly straightforward. There’s a list of all traces, with several options to search/filter (hidden in photo).
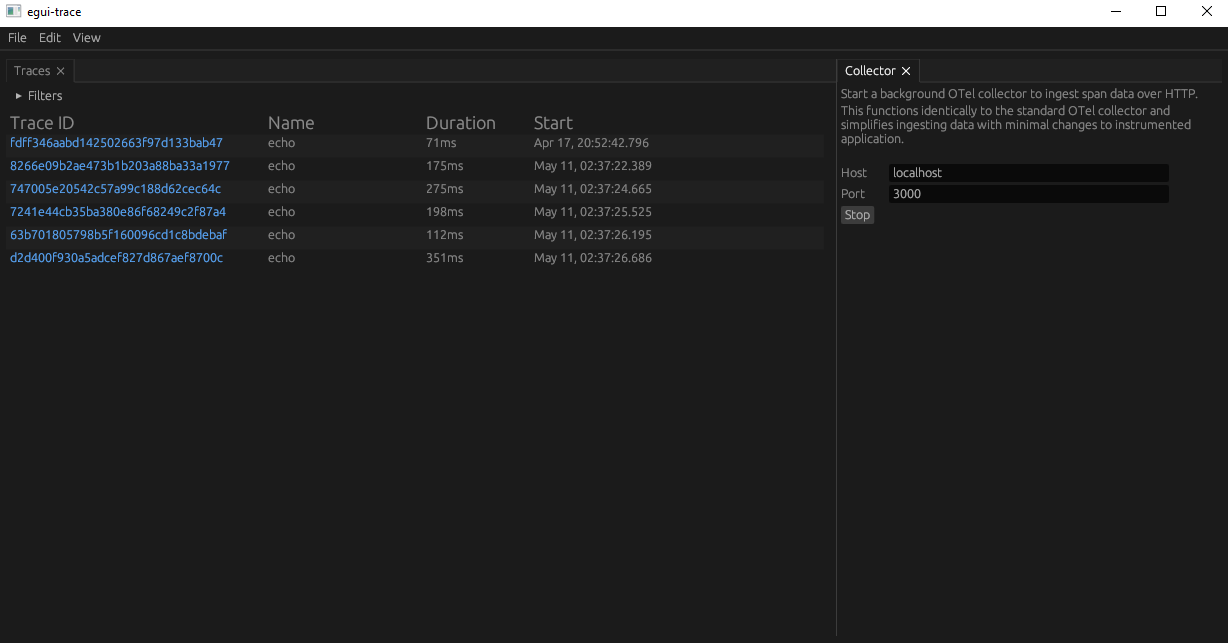
Figure 1: Trace list and collector panel
Selecting a trace presents you with a span waterfall. Clicking on spans within the waterfall open details about the target span.
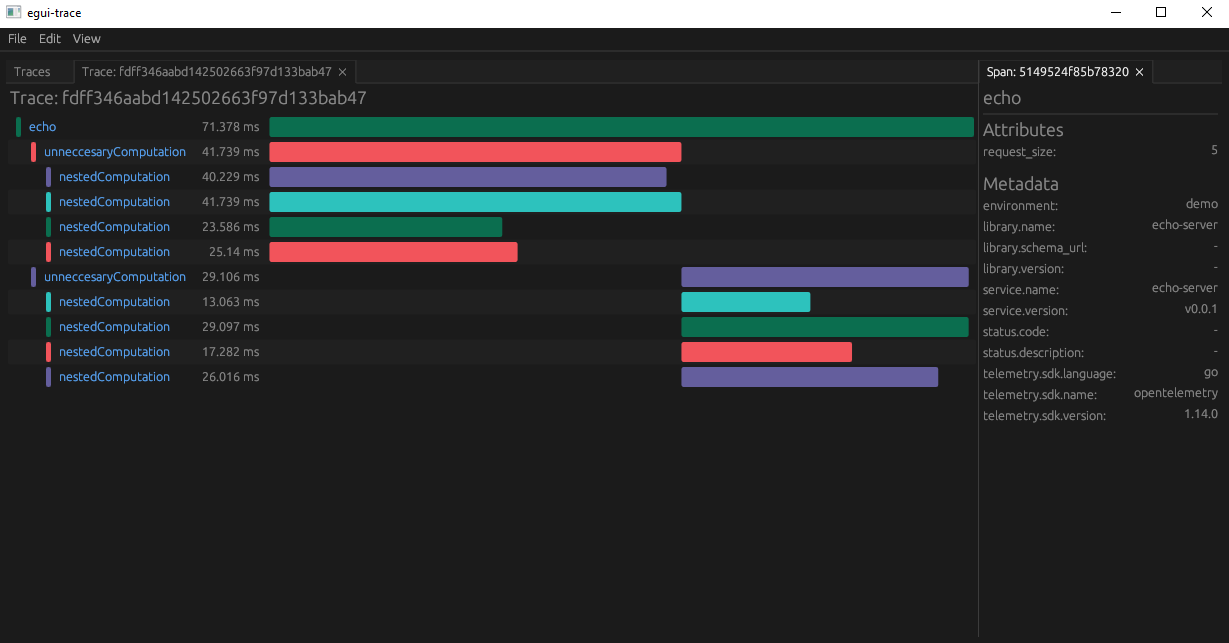
Figure 2: Trace waterfall and span metadata
Pretty standard of any half-baked trace explorer.
And that’s about it, save one usability feature…
Docking
If you were really paying attention to the previous two screenshots, you likely noticed the tabs.
Thanks to the wonderful community around egui, there was already a solution for dockable tabs that is incredibly easy to integrate: egui_dock. This allows us to open several traces at once for comparison, keep the trace list as a side bar, and plenty more. It allows you to personalize your workflow in the app.
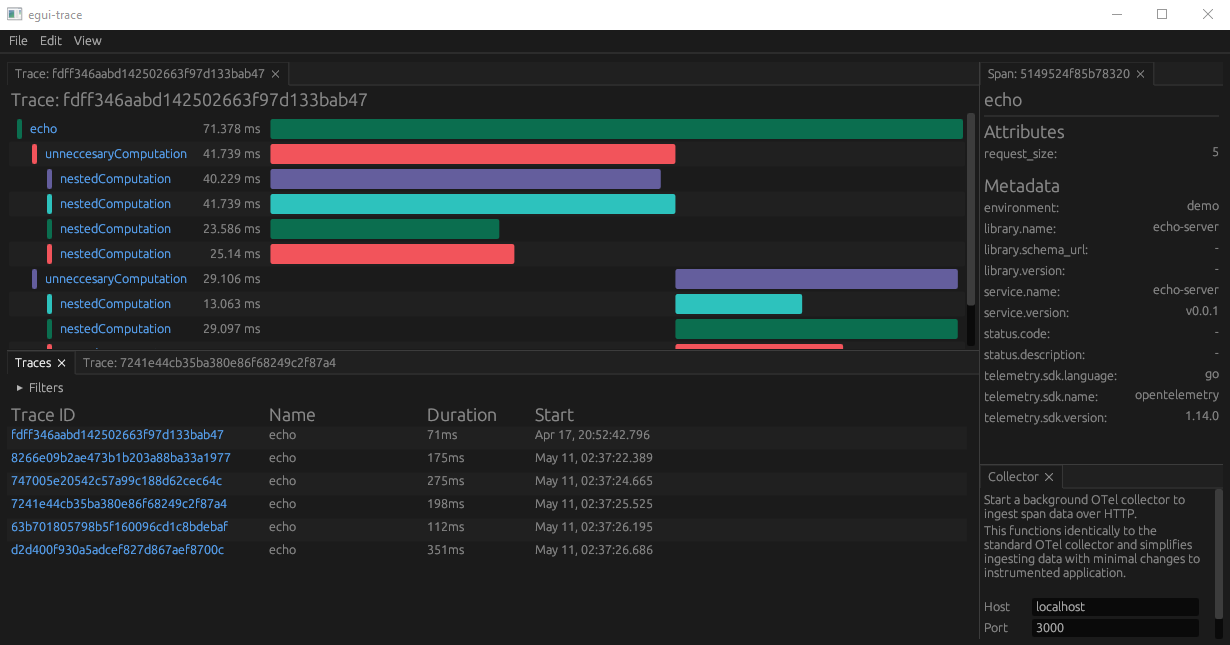
Figure 3: Panels can be placed anywhere
It’s certainly not revolutionary, but dramatically improves the satisfaction of using the app, in my opinion.
More than MVP
While I achieved what I wanted in the two weeks I had available, here are tons things I’d still love to add, when I have some time.
A few quick wins I hope to get to soon:
- Saving panel layouts
- Appearance customizations
- Basic visualizer for trace list
There are plenty more big features I have in mind too, if I decide to spend more time on the project. I'll keep those to myself for now though.
Naturally, the code could use some cleanup too. Throwing together a functioning prototype in one week does not lead to an ideal code base.
If you use egui-trace and get value from it, I’d love to hear about it. And if you run into any issues, please consider submitting an issue on Github.
End
Finally, a quick thanks to a previous coworker (whom I greatly miss) for encouraging me to write this through my own enjoyment of his blog posts. For anyone still reading, you should definitely go read his blog.